数据整理中怎样去掉各组的异常值?

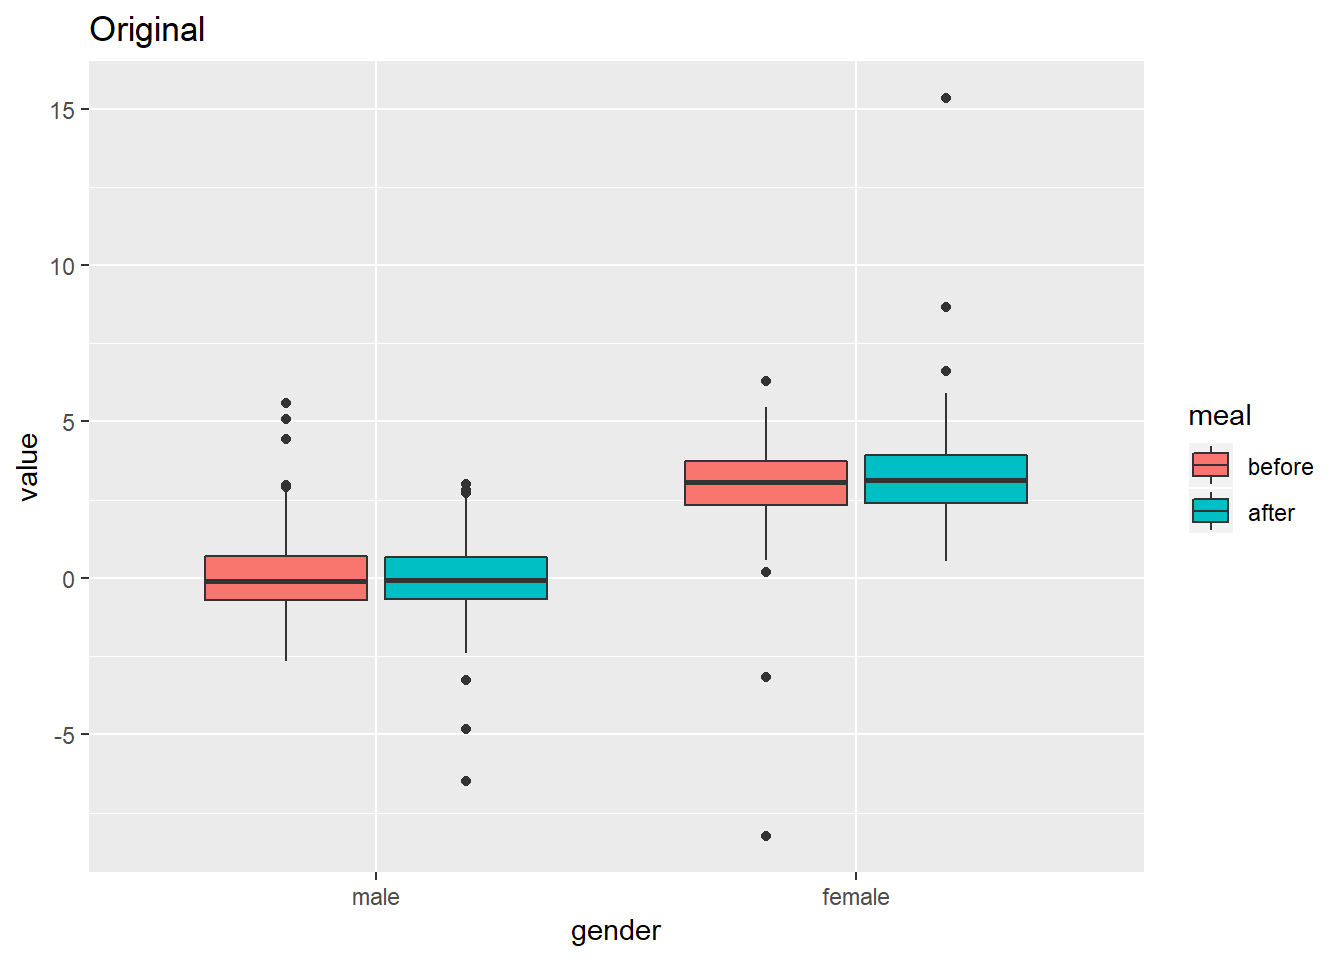
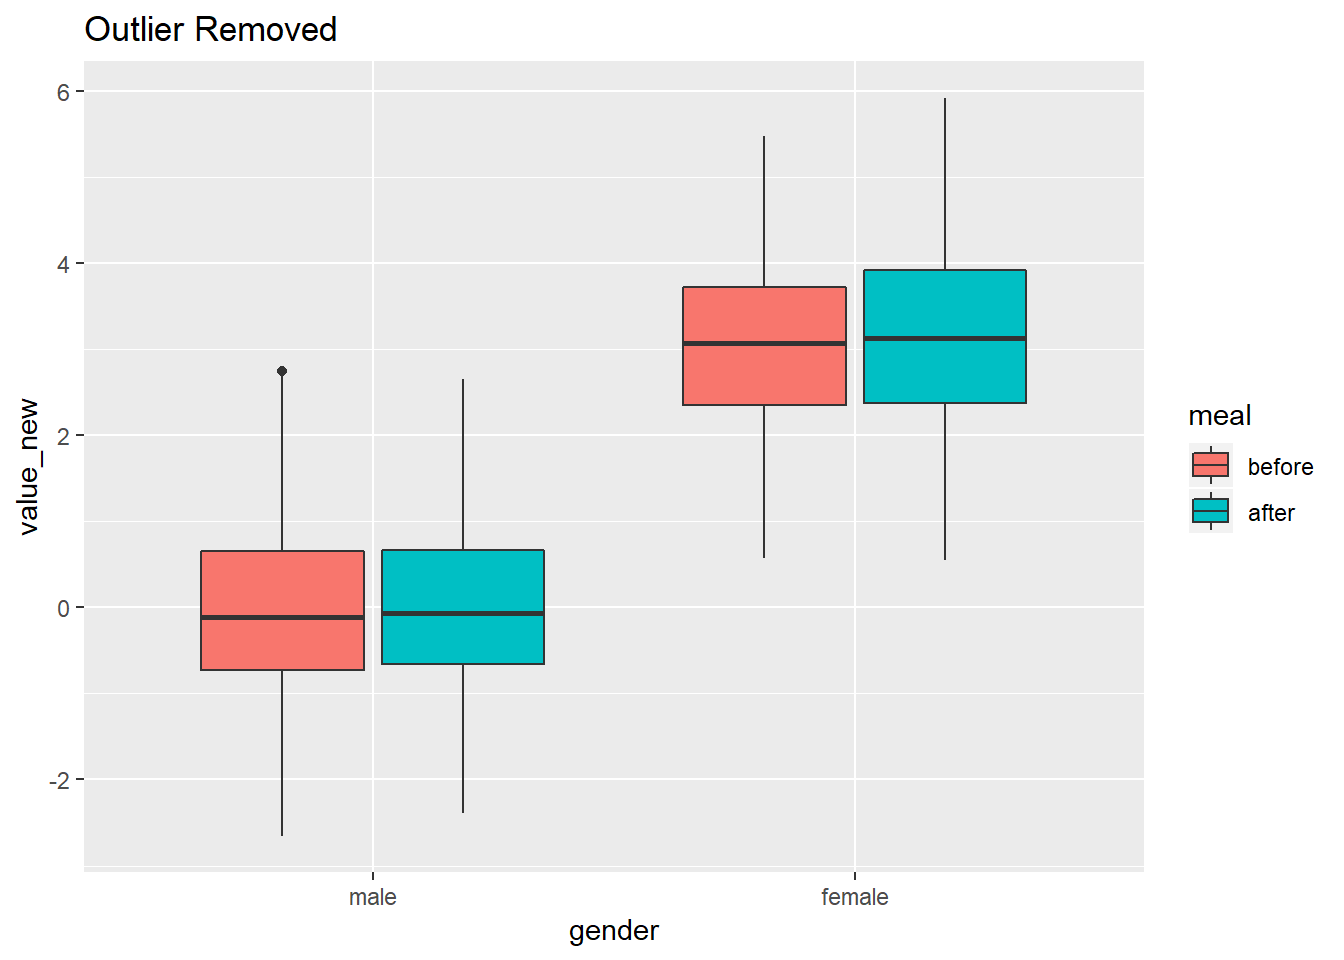
假设500人中有男女若干,现要比较饭前(before)和饭后(after)某生理指标的变化。由于数据誊写错误,测量指标中出现了一些异常值(outlier)。 问,如果按照性别以及饭前饭后分组,怎样去掉各组内的异常值?

思路:先定义识别和转换异常值的函数, 将一个向量中的异常值转换为NA。再用dplyr程序包将该函数应用于各组数据。

解答:

1
2
3
4
5
6
7
8
9
10
11
12
13
14
15
16
17
18
19
20
21
22
23
24
25
26
27
28
29
30
31
32
33
34
35
36
37
38
39
40
41
42
43
44
library(ggplot2)
library(dplyr)
##
## Attaching package: 'dplyr'
## The following objects are masked from 'package:stats':
##
## filter, lag
## The following objects are masked from 'package:base':
##
## intersect, setdiff, setequal, union
## 参考 https://stackoverflow.com/questions/49982794/remove-outliers-by-group-in-r
## 对于一个向量x, 先计算其上下四分位数
## 若任何值超过上四分位数的1.5倍,或低于下四分位数的1.5倍,一般认为是异常值
## 下面的函数将异常值转换为NA
remove_outliers <- function(x, na.rm = TRUE, ...) {
qnt <- quantile(x, probs=c(.25, .75), na.rm = na.rm, ...)
H <- 1.5 * IQR(x, na.rm = na.rm)
y <- x
y[x < (qnt[1] - H)] <- NA
y[x > (qnt[2] + H)] <- NA
y
}

## 生成一套随机数据

test_dat <- data.frame(
ID = c(1:500,1:500),
age = rep(sample(18:70, 500, replace = TRUE), 2) ,
gender = gl(2, 500, labels = c("male", "female")),
meal = gl(2, 500, labels = c("before", "after"))[sample(1:1000)],
value = c(c(rnorm(490), rnorm(10)*5), c(rnorm(490), rnorm(10)*5) + 3)
)

head(test_dat)
## ID age gender meal value
## 1 1 25 male after -1.233542780
## 2 2 25 male after -0.003499835
## 3 3 54 male after -0.265865215
## 4 4 24 male after 1.281983039
## 5 5 21 male after -0.114771555
## 6 6 41 male after 0.763784322
ggplot(test_dat, aes(x = gender, y = value, fill = meal)) +
geom_boxplot() +
ggtitle("Original")

img

1
2
3
4
5
6
7
8
test_dat2 <- test_dat %>%
group_by_at(.vars = c("meal", "gender")) %>%
mutate(value_new = case_when(TRUE ~ remove_outliers(value), TRUE ~ value))

ggplot(test_dat2, aes(x = gender, y = value_new, fill = meal)) +
geom_boxplot() +
ggtitle("Outlier Removed")
## Warning: Removed 18 rows containing non-finite values (stat_boxplot).

img